Parameters
The shape of the thirty points shown while the chart isn't given its own values; changing it draws the line in again.
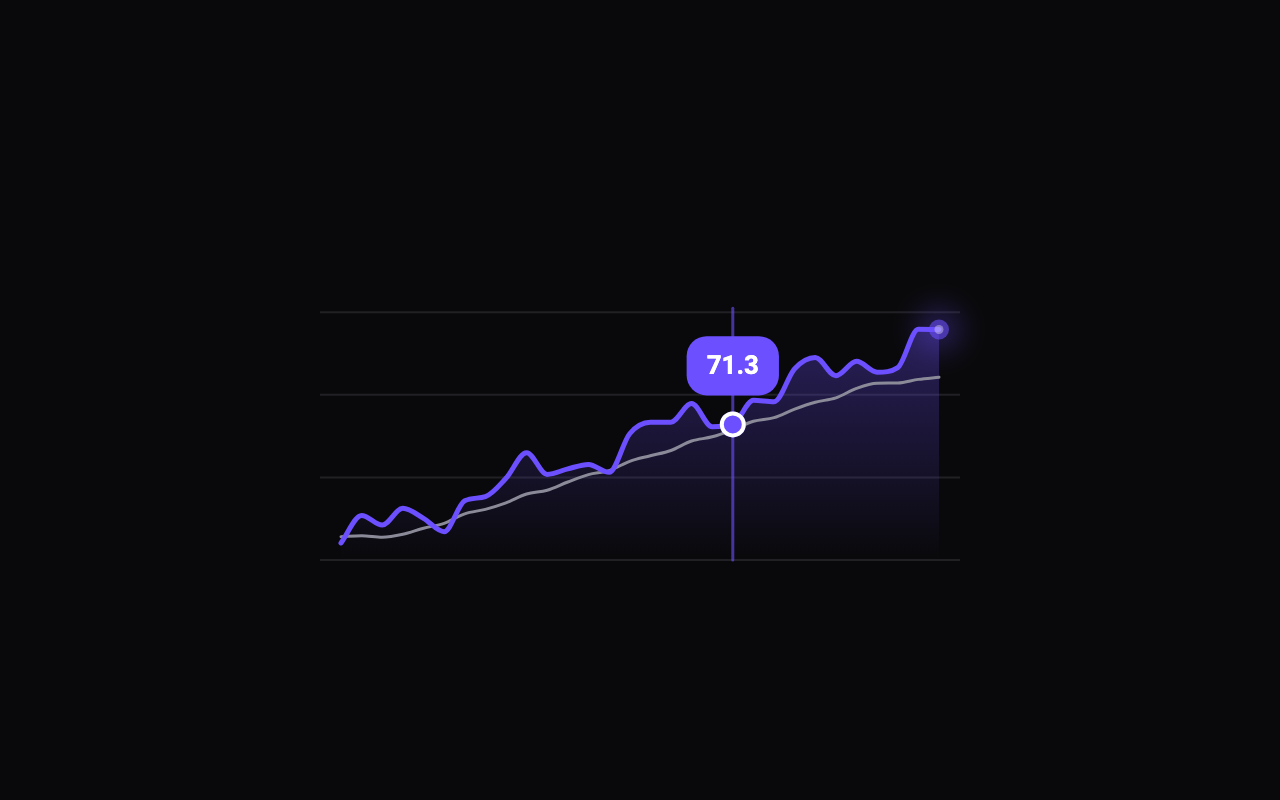
The colour of the line, its fill, the head dot and the value chip.
The colour of the comparison line and the faint grid.
The thickness of the line; the comparison line is thinner.
Draws a smooth curve through the points, which never overshoots them; off draws straight segments.
How strong the gradient under the line is; 0 turns the fill off.
Draws faint horizontal lines behind the chart.
A glowing dot that leads the line as it draws and stays at its end.
Draws the grey comparison line alongside the main one.
Seconds the line takes to draw in; 0 draws it at once.
The chart's width.
The chart's height.
Loading Preview…
Send to your coding agent
Add Sheen's MCP server once, then paste the prompt. No key or account needed.
claude mcp add --transport http sheen https://sheen.ciroapps.com/api/mcp
Use the Sheen MCP server to add the Line Chart Component to this Flutter app. Call get_export with componentId "line-chart" and parameters {"sample":"rising","lineColor":"6C4FFF","compareColor":"8A8A99","lineWidth":2.5,"curved":true,"fillStrength":0.5,"showGrid":true,"showHead":true,"showCompare":true,"duration":1.4,"width":320,"height":180}, then follow the install steps it returns. (Tuned in the Sheen Playground: https://sheen.ciroapps.com/c/line-chart?sample=rising&lineColor=6C4FFF&compareColor=8A8A99&lineWidth=2.5&curved=true&fillStrength=0.5&showGrid=true&showHead=true&showCompare=true&duration=1.4&width=320&height=180)